Monitoring the service status in a dashboard
Note
The complete example can be found in plugin/dashboard/.
As a part of the infrastructure, one may also want to monitor the service status and show it in a dashboard. To do that, we can use:
bc = BertClient(ip='server_ip')

json.dumps(bc.server_status, ensure_ascii=False)
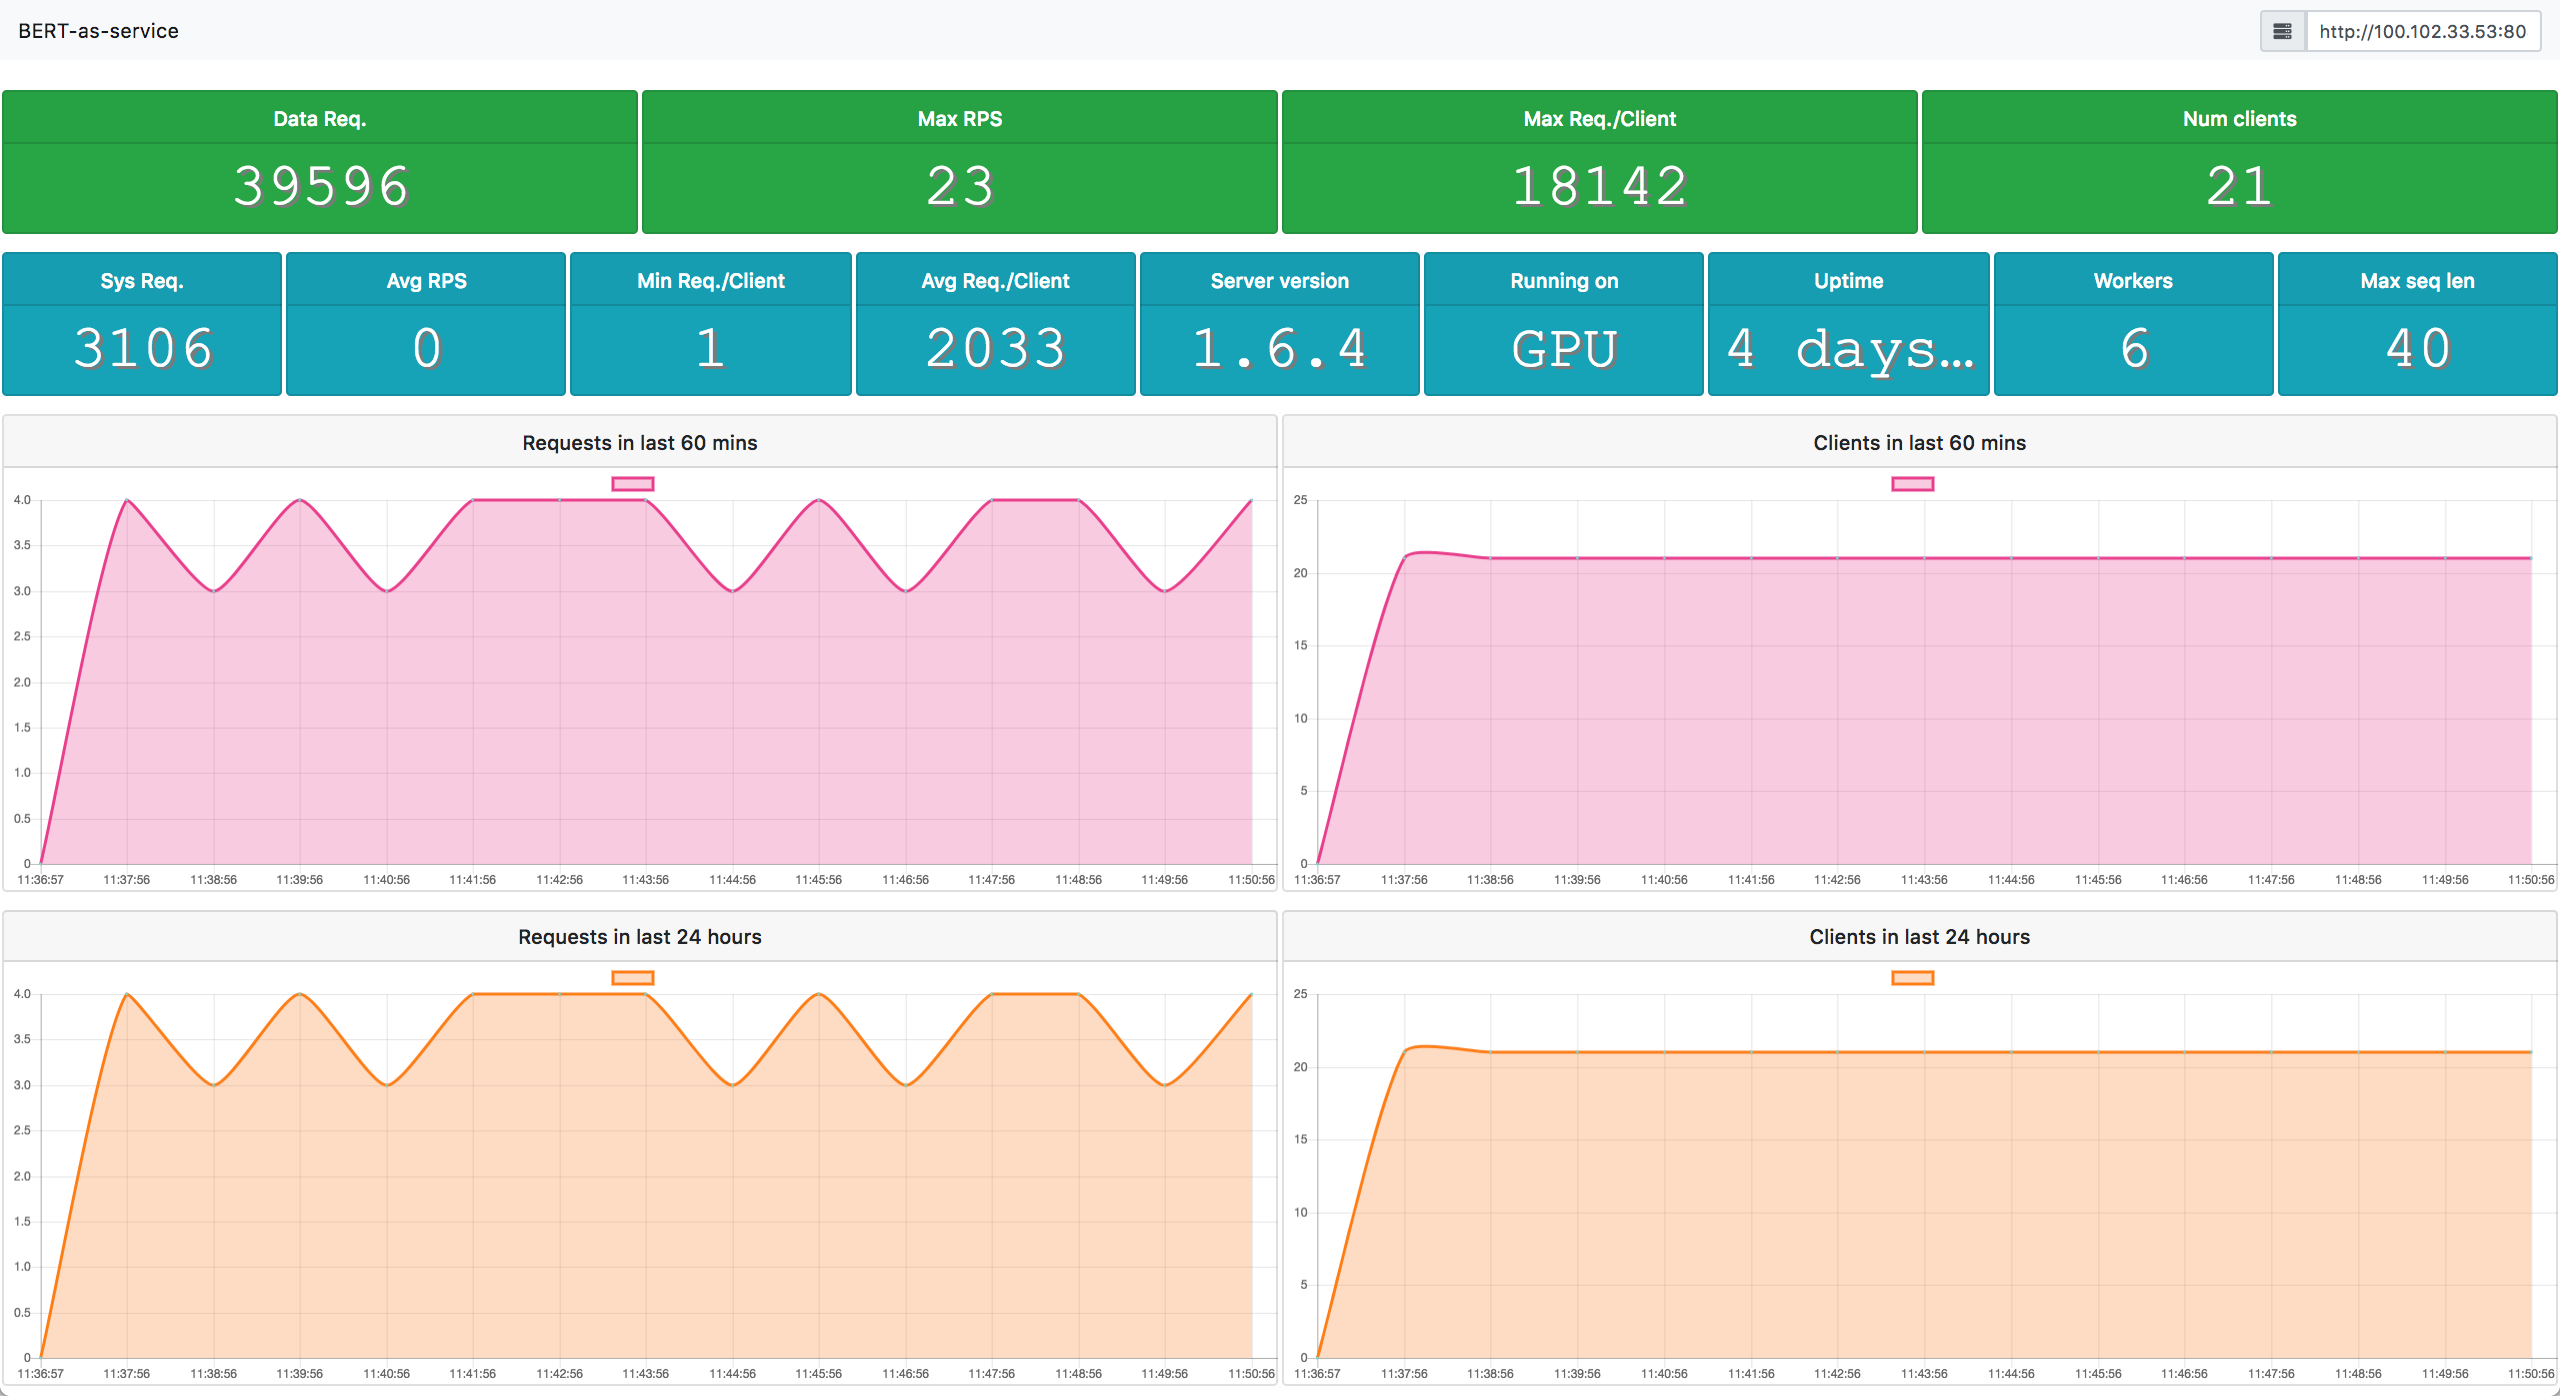
This gives the current status of the server including number of requests, number of clients, etc. in JSON format. The only thing remained is to start a HTTP server for returning this JSON to the frontend that renders it.
plugin/dashboard/index.html shows a simple dashboard based on Bootstrap and Vue.js.